Blog

GARDAG Water Monitoring Programme Plan
GARDAG WATER MONITORING PROGRAMME
Good data is an invaluable resource in confirming the health of our water resources.
The Garden Route area is under increasing pressure from development and the blue and green drop water reports are biased to what the George Local Municipality must report as a minimum.
contact details

Name: Ms. Sonia Veltman
Business phone: 0740411444
Mobile: 0740411444
Email Enquiry: sonia.veltman@gmail.com
WATER MONITORING PROGRAMME
Background
Good data is an invaluable resource in confirming the health of our water resources. The Garden Route area is under increasing pressure from development and the blue and green drop water reports are biased to what the George Local Municipality must report as a minimum. Other governmental agencies’ monitoring points are sparse and often monitor only background / ambient / unimpacted areas. The GARDAG monitoring programme aims to create a baseline of independent data to either confirm or challenge the available information, as well as add to the sustainable development of the area, to not reach a future the available water resources cannot support.
Objectives
Monitoring is the task of measuring selected parameters in pre-determined time intervals. “If you can’t measure it, you can’t manage it”, is a famed motto in the water science community. Monitoring for water resource health is different from response monitoring, at the time of pollution events, and aims to:Assess the temporal water quality condition of resources, likely to be impacted upon by development.
Identify potential pollution sources that is responsible for significant deviations in the trends.
Develop strategies / plans for enacting change in water users’ behaviour within the area.
This programme also targets the upcoming professionals and young learners of school age, the next generation that needs to keep the water systems healthy and local authorities accountable.
Methodology
Different types of monitoring are utilised for proper water management and can include water quality, rainfall, groundwater levels, and spring/river flow. A specialist technical approach to monitoring both catchment and cumulative impact is required, with proper controls and data dissemination. To reach the objectives, the monitoring network needs to confirm the:
Health of aquatic ecosystems.
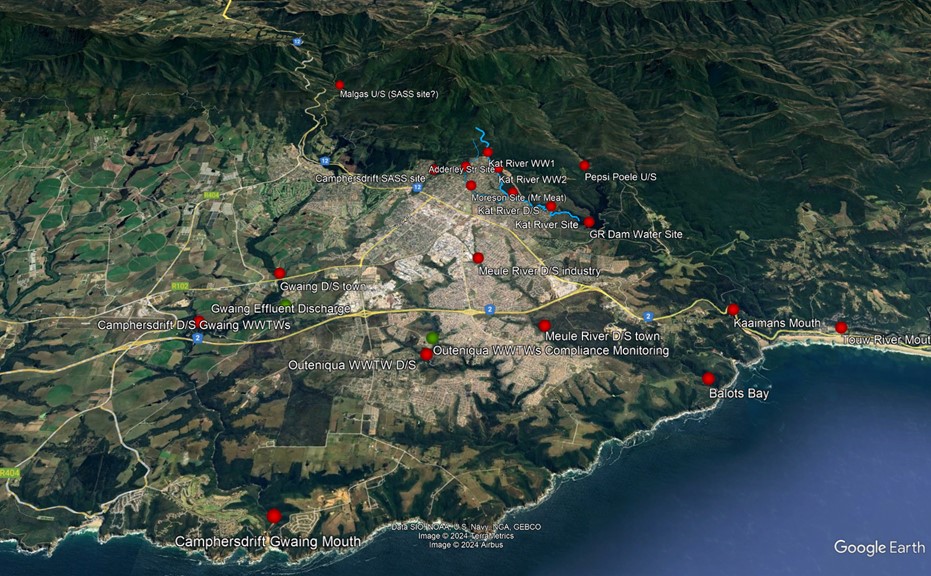
Each monitoring site selected will have a unique set of parameters that needs to be monitored and is dependent on the type of monitoring site and the aim of the site’s inclusion in the monitoring network. GARDAG have developed a proposed monitoring network for the Garden Route area and the selected monitoring points are shown on the map attached. Basic protocols followed for the network development and reporting includes:
- Site selection: U/S - upstream, D/S - downstream, WWTWs - Wastewater treatment works.
- Potential impact definition: changes in environment that could influence site health (mainly anthropogenic effects).
- Sampling protocols: A standardised approach to enable trend analyses. Parameters for analyses is site specific and evaluated over time.
- Reporting: Describe each site, what are the biggest influences on water visible at the site. Trends occur over time – reporting is done after each sampling run or annually.
State of Rivers initiative
GroundTruth (http://groundtruth.co.za/), in collaboration with the University of KwaZulu-Natal (UKZN), are undertaking a project commissioned by the Water Research Commission (WRC), with funding and support from UNICEF, on The State of Citizen Science for Water Quality Monitoring in southern Africa. This project aimed to generate data that can be used to develop a national State of Rivers (SoR) report from a citizen science (CS) perspective, as well as generate data to inform SDG reporting, specifically targets under SDG 6.3.2 (which monitors the proportion of bodies of water with good ambient water quality).
Scientific tools available to citizens for inputs to this monitoring initiative includes mini-SASS (https://minisass.org/), clarity tubes, riparian health audits, chemical testing with WaterCAN test kits (https://watercan.org.za/) and/or E.Coli test tubes (Praecautio). Of these tools GARDAG has implemented the mini-SASS, WaterCan test kits since 2022 and more recently also the E.Coli test tubes in the Garden Route area. Special thanks to OUTA whom developed and sponsored kits of the WaterCAN initiative and Afriforum for further funding WaterCAN kits at the start of the GARDAG monitoring initiative.
Sampling Protocols
Mini-SASS
The South African Scoring System version 5 (SASS5) protocol is a scientifically rigorous biomonitoring method that is accredited to ISO standards and must be performed by an accredited SASS5 practitioner. Mini-SASS is a simplified, citizen-based version of SASS5 that can be performed by anyone with the basic introduction to the mini-SASS method. It uses the presence of water “nunus” (water bugs, not vertebrae like fish, crabs or frogs) as an indication of river health. Different nunus has different sensitivities and more sensitive nunus will disappear as river health declines, or possibly re-appear as river health improves.
Mini-SASS should be conducted in river reaches with flowing water with 3 types of habitats to sample: rocky habitat, vegetative habitat and GSM (sand and mud) habitat. Rocky and GSM habitats are sampled through shuffling your feet and capturing what comes up with a net, vegetative areas are sampled through scooping the net underneath the vegetation in a circular motion.
All the sampled material is deposited into a white tray for identification of species that occur in the river. Make sure nunus clinging to the net is not left behind, remove gently with your hands all debris and deposit into the tray. The nunus are identified and recorded on the sheet, with the help of the mini-SASS dichotomous key chart. The sensitivity score is then calculated on the sheet and uploaded to the mini-SASS website.
WaterCAN test kits
WaterCAN is an OUTA initiative, with a growing network of citizen science activists who are committed water guardians and willing stewards advocating for clean, safe and sustainable water. A booklet on how to sample and use the kit is included in every kit purchased. To see more information on the initiative and a tutorial on how the kits are used, visit the website https://watercan.org.za/. To purchase kits and become involved send an email to info@watercan.org.za.
Ecoli tests
Water is collected with a sterile syringe directly from the water source and the test tube filled and capped. The tube is then stored for 24 hours at body temperature (37C), the optimal growing conditions for E.Coli. If the water in the tube’s colour turns green the presence of E.Coli is confirmed, if it turns yellow, the presence of coliform bacteria is confirmed. The time it takes for the water to change colour is an indicator of the number of bacteria present and can be read of the “time – colour indicator table”. No change in colour indicates the absence of both E.Coli and coliform bacteria.
Quantitative laboratory analysis
Apart from the citizen science tools available, GARDAG also takes water samples for quantitative laboratory analysis as needed. These are expensive and used on a lesser frequency, however sampling protocols are discussed below.
Sample preparation is undertaken according to laboratory requirements (filtration, specific preservative, etc.). Care must be taken to ensure that the samples collected are sufficiently large enough (1ℓ) to allow the laboratory to run duplicate analysis if required. Samples is stored and transported at cool temperatures.
Field observations for each sampling point are recorded on field data sheets. The field technician collecting the water samples will keep a record of the sampling session by filling in a sampling sheet check list form.
The chain of custody form will be completed when the samples are transported and transferred to a SANAS-accredited laboratory for analysis.
General:
Preservation techniques (including filtering) and laboratory instructions should be followed. It is recommended that two samples are taken, one 1L bottle for inorganic chemical analyses and one 500ml bottle for microbiological analyses. This could vary between laboratories and should be confirmed.
If groundwater sampling via the purging methodology is considered: in the event of the borehole being pumped dry, a recovery time of approximately 2 weeks should be allowed prior to returning to site for sampling via single use bailers.
NOTE: The preservation methods should be discussed with the laboratory, in some cases filtering and preservation may or may not be required provided the samples are submitted to the laboratory as soon as practically possible.
Frequency and Reporting
Monitoring frequency will depend on the type and purpose of monitoring. Monthly monitoring is typically done with WaterCAN test kits, which are inexpensive and a good set of indicator parameters. 3- or 6-monthly monitoring can be utilised with laboratory testing, which are more expensive but more quantitive (give exact values to compare between time intervals). Mini-SASS is time cosuming and although very helpful on a monthly base, mostly done in longer intervals of 3- or 6-monthly depending on the river conditions.
All water monitoring data dissemination and reporting are evaluated by a GARDAG registered Pri. Sci. Nat: Environmental / Water Scientist. Memorandums will include basic representation of data, evaluated against appropriate water quality guidelines with related discussions. The Annual report should include a more extensive evaluation of the results obtained during the year.
Reports can include statistical summaries of parameters, time-series graphs, linear trend determinations, trend analyses with seasonal changes and rainfall variation considered, water quality thematic maps indicating pollution sources and impacts on the receiving water body, as well as a discussion on the observed changes.
WaterCAN results are uploaded to the WaterCAN website.
Annual results are uploaded to the GARDAG website blog. Read more on the results of 2024 here.